


This article is part of our Collette Calls series.
It's great to be back home after yet another wonderful First Pitch Arizona trip last week. It was great to see old friends, make new ones and have several people introduce themselves and share their gratitude for the work I published this year. It was just the recharge I needed after a long and stressful baseball season pulling for both real and fantasy teams to win titles. I view FPAZ as my own personal All-Star weekend even though the schedule is anything but a break with early-morning sessions and late-night podcasts.
My responsibilities at the conference this year included a panel covering how steals impacted 2023 as well a live show with Justin Mason and Paul Sporer for the most recent episode of The Sleeper and the Bust podcast. You can listen to the latter in your favorite podcast app and I hope it is as enjoyable to listen to as it was to record. The former was limited to me presenting a few slides and talking through the story behind those slides, but I am going to go into the longform of that data for you in this installment because I believe that this data will be incredibly helpful for you as you plan for your 2024 drafts (or in the drafts you've already begun). I know some of you have already started drafting this winter as I see ADP data out there and witnessed a few live drafts in Phoenix this past weekend, and even drafted myself in
It's great to be back home after yet another wonderful First Pitch Arizona trip last week. It was great to see old friends, make new ones and have several people introduce themselves and share their gratitude for the work I published this year. It was just the recharge I needed after a long and stressful baseball season pulling for both real and fantasy teams to win titles. I view FPAZ as my own personal All-Star weekend even though the schedule is anything but a break with early-morning sessions and late-night podcasts.
My responsibilities at the conference this year included a panel covering how steals impacted 2023 as well a live show with Justin Mason and Paul Sporer for the most recent episode of The Sleeper and the Bust podcast. You can listen to the latter in your favorite podcast app and I hope it is as enjoyable to listen to as it was to record. The former was limited to me presenting a few slides and talking through the story behind those slides, but I am going to go into the longform of that data for you in this installment because I believe that this data will be incredibly helpful for you as you plan for your 2024 drafts (or in the drafts you've already begun). I know some of you have already started drafting this winter as I see ADP data out there and witnessed a few live drafts in Phoenix this past weekend, and even drafted myself in the XFL draft.
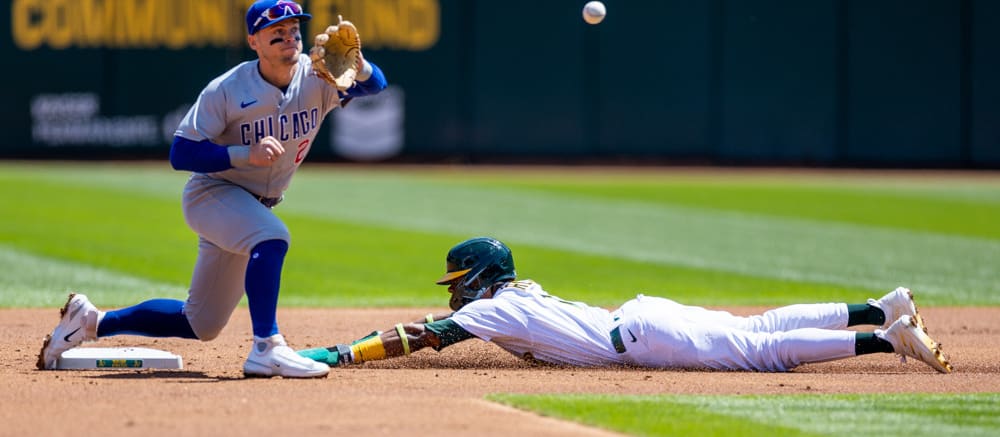
My work on steals this past offseason began with this piece in which I raised the alert that, based off what we witnessed in the minor leagues in 2021 and 2022, a surge in steals was coming. That first piece looked at hitters would could see a boost in steals as well as pitchers who could potentially struggle to adjust to the new environment based off their historically slow times to the plate. A few months later, I raised the alarm further by warning that we were about to see the most attempted steals in the league since the 2012 season using what I would call a Back of Napkin (BON) projection system using recent performance to predict future performance. This was all based off three knowns:
- There would be bigger bases
- There would be limited throwovers
- The rule changes, which were implemented in the minors in previous seasons, led to sizable increase in stolen base attempts
What we did not know heading into the 2023 season:
- How to project the impact of steals in 2023
- How to project the increase of steals in 2023
- How would steals be distributed
- How much more successful would stolen base attempts be
I did not want to let that stop me from attempting to quantify what could happen in baseball, because the projections around the impact of these rules ranged from a conservative 10 percent improvement to a progressive 30 percent improvement. Even that progressive projection was below what we saw in the minors, so I created a BON formula to attempt to quantify what laid ahead.
The formula was simple: find the spring-training attempted stolen base rate from recent seasons and apply that over 2,430 regular season games, then reduce that figure by the annual difference in spring training versus regular season attempt rates.
How did I come up with that formula? Eno Sarris mentioned on an episode of Rates and Barrels that the league tends to run about a quarter less in the regular season than they do in spring training, and since Eno is a smart guy, I started there. I pulled the data from the past 12 full seasons and found that the stolen base rate declined 22.72 percent to be exact over that time. More impressively, despite some year over year noise, the difference between the BON projected total and the final projection total for steals was within 0.4 percent!
Season | Spring Rate | Regular Rate | Projected | Final | Difference |
|---|---|---|---|---|---|
2010 | 2.04 | 1.68 | 3831 | 4088 | 6.7% |
2011 | 2.16 | 1.86 | 4055 | 4540 | 12.0% |
2012 | 2.22 | 1.80 | 4169 | 4365 | 4.7% |
2013 | 1.96 | 1.52 | 3682 | 3700 | 0.5% |
2014 | 1.92 | 1.56 | 3606 | 3799 | 5.4% |
2015 | 1.88 | 1.46 | 3529 | 3569 | 1.1% |
2016 | 1.90 | 1.46 | 3565 | 3538 | -0.8% |
2017 | 2.00 | 1.42 | 3756 | 3461 | -7.8% |
2018 | 2.04 | 1.42 | 3833 | 3432 | -10.5% |
2019 | 1.94 | 1.28 | 3642 | 3112 | -14.5% |
2021 | 1.64 | 1.20 | 3078 | 2924 | -5.0% |
2022 | 1.54 | 1.34 | 2892 | 3297 | 14.0% |
AVG | 1.94 | 1.50 | 3636 | 3652 | 0.4% |
I look at that chart and see the resurgence of power late in the previous decade contributing to the noise, but I was rather pleased with the overall results. Visually, the graph shows a declining trend in steals:

This spring, we saw stolen base attempts per contest spike to 2.34, so that alone should have been enough to see that nearly every projection was going to miss its mark. My final prediction was a 33 percent increase in stolen bases, with the league stealing 3,302 bases. I missed the mark by 201 steals (six percent) only because I was conservative in how the league would thwart steals and did not trust year one of the BON input. I should have, as the system ended up missing the mark on attempted steals by just 0.6 percent:
Season | Spring Rate | Projected | Final | Difference |
|---|---|---|---|---|
2010 | 2.04 | 3831 | 4088 | 6.7% |
2011 | 2.16 | 4055 | 4540 | 12.0% |
2012 | 2.22 | 4169 | 4365 | 4.7% |
2013 | 1.96 | 3682 | 3700 | 0.5% |
2014 | 1.92 | 3606 | 3799 | 5.4% |
2015 | 1.88 | 3529 | 3569 | 1.1% |
2016 | 1.90 | 3565 | 3538 | -0.8% |
2017 | 2.00 | 3756 | 3461 | -7.8% |
2018 | 2.04 | 3833 | 3432 | -10.5% |
2019 | 1.94 | 3642 | 3112 | -14.5% |
2021 | 1.64 | 3078 | 2924 | -5.0% |
2022 | 1.54 | 2892 | 3297 | 14.0% |
2023 | 2.34 | 4394 | 4369 | -0.6% |
AVG | 1.97 | 3695 | 3707 | 0.3% |
The league ran wild, attempting 33 percent more steals than it did the previous season and successfully stealing 41 percent more bases than it did in 2022. BON was off by just 24 stolen base attempts when the 2023 season was said and done:

Teams became more aggressive in their attempts at both bases as we learned last week, as attempts of second rose 25 percent while attempts of third rose 54 percent year over year. The larger impact was distribution of steals.
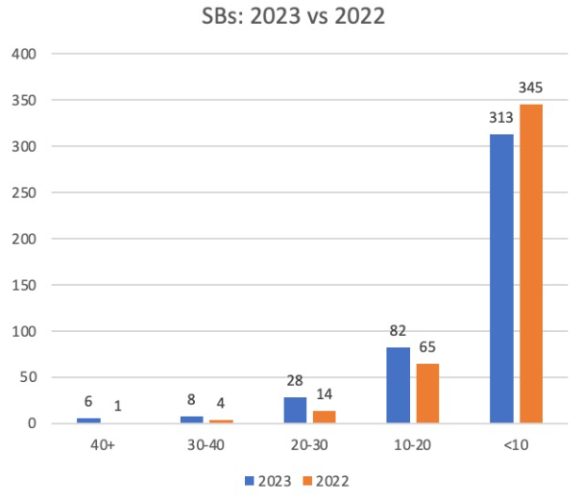
2022 saw Jon Berti sit alone in the 40+ steals group, but 2023 saw six different players steal at least 40 bases. Whereas 2022 saw 19 players with 20 or more steals, 2023 saw 42 players with at least 20 steals and 126 with at least 10 steals:
What have we learned? Do not ignore spring stats. All stats matter, in some way, shape, or form. It's up to you to determine how to synthesize them. My BON system ended up giving me a lodestar by which to navigate my fantasy season and win both AL LABR as well as a Draft and Hold NFBC league this season. By the way, that 2.34 attempts per game number in the spring was the same in early March as it was by the end of spring training, so you should know in advance of the peak of draft season what your 2024 input will be. Keep in mind, there are no announced rule changes to change the variables in these equations, and catchers are unlikely to add to their pop times over the winter.
Until we see some other levers pulled by the league office, this appears to be our new reality given how wildly successful it was for offense. Pitchers weren't as happy, as starting pitchers saw their collective ERA rise from 4.05 in 2022 to 4.45 this past season.


